EDITORIAL WORK
Magazine, newspaper and layout design.
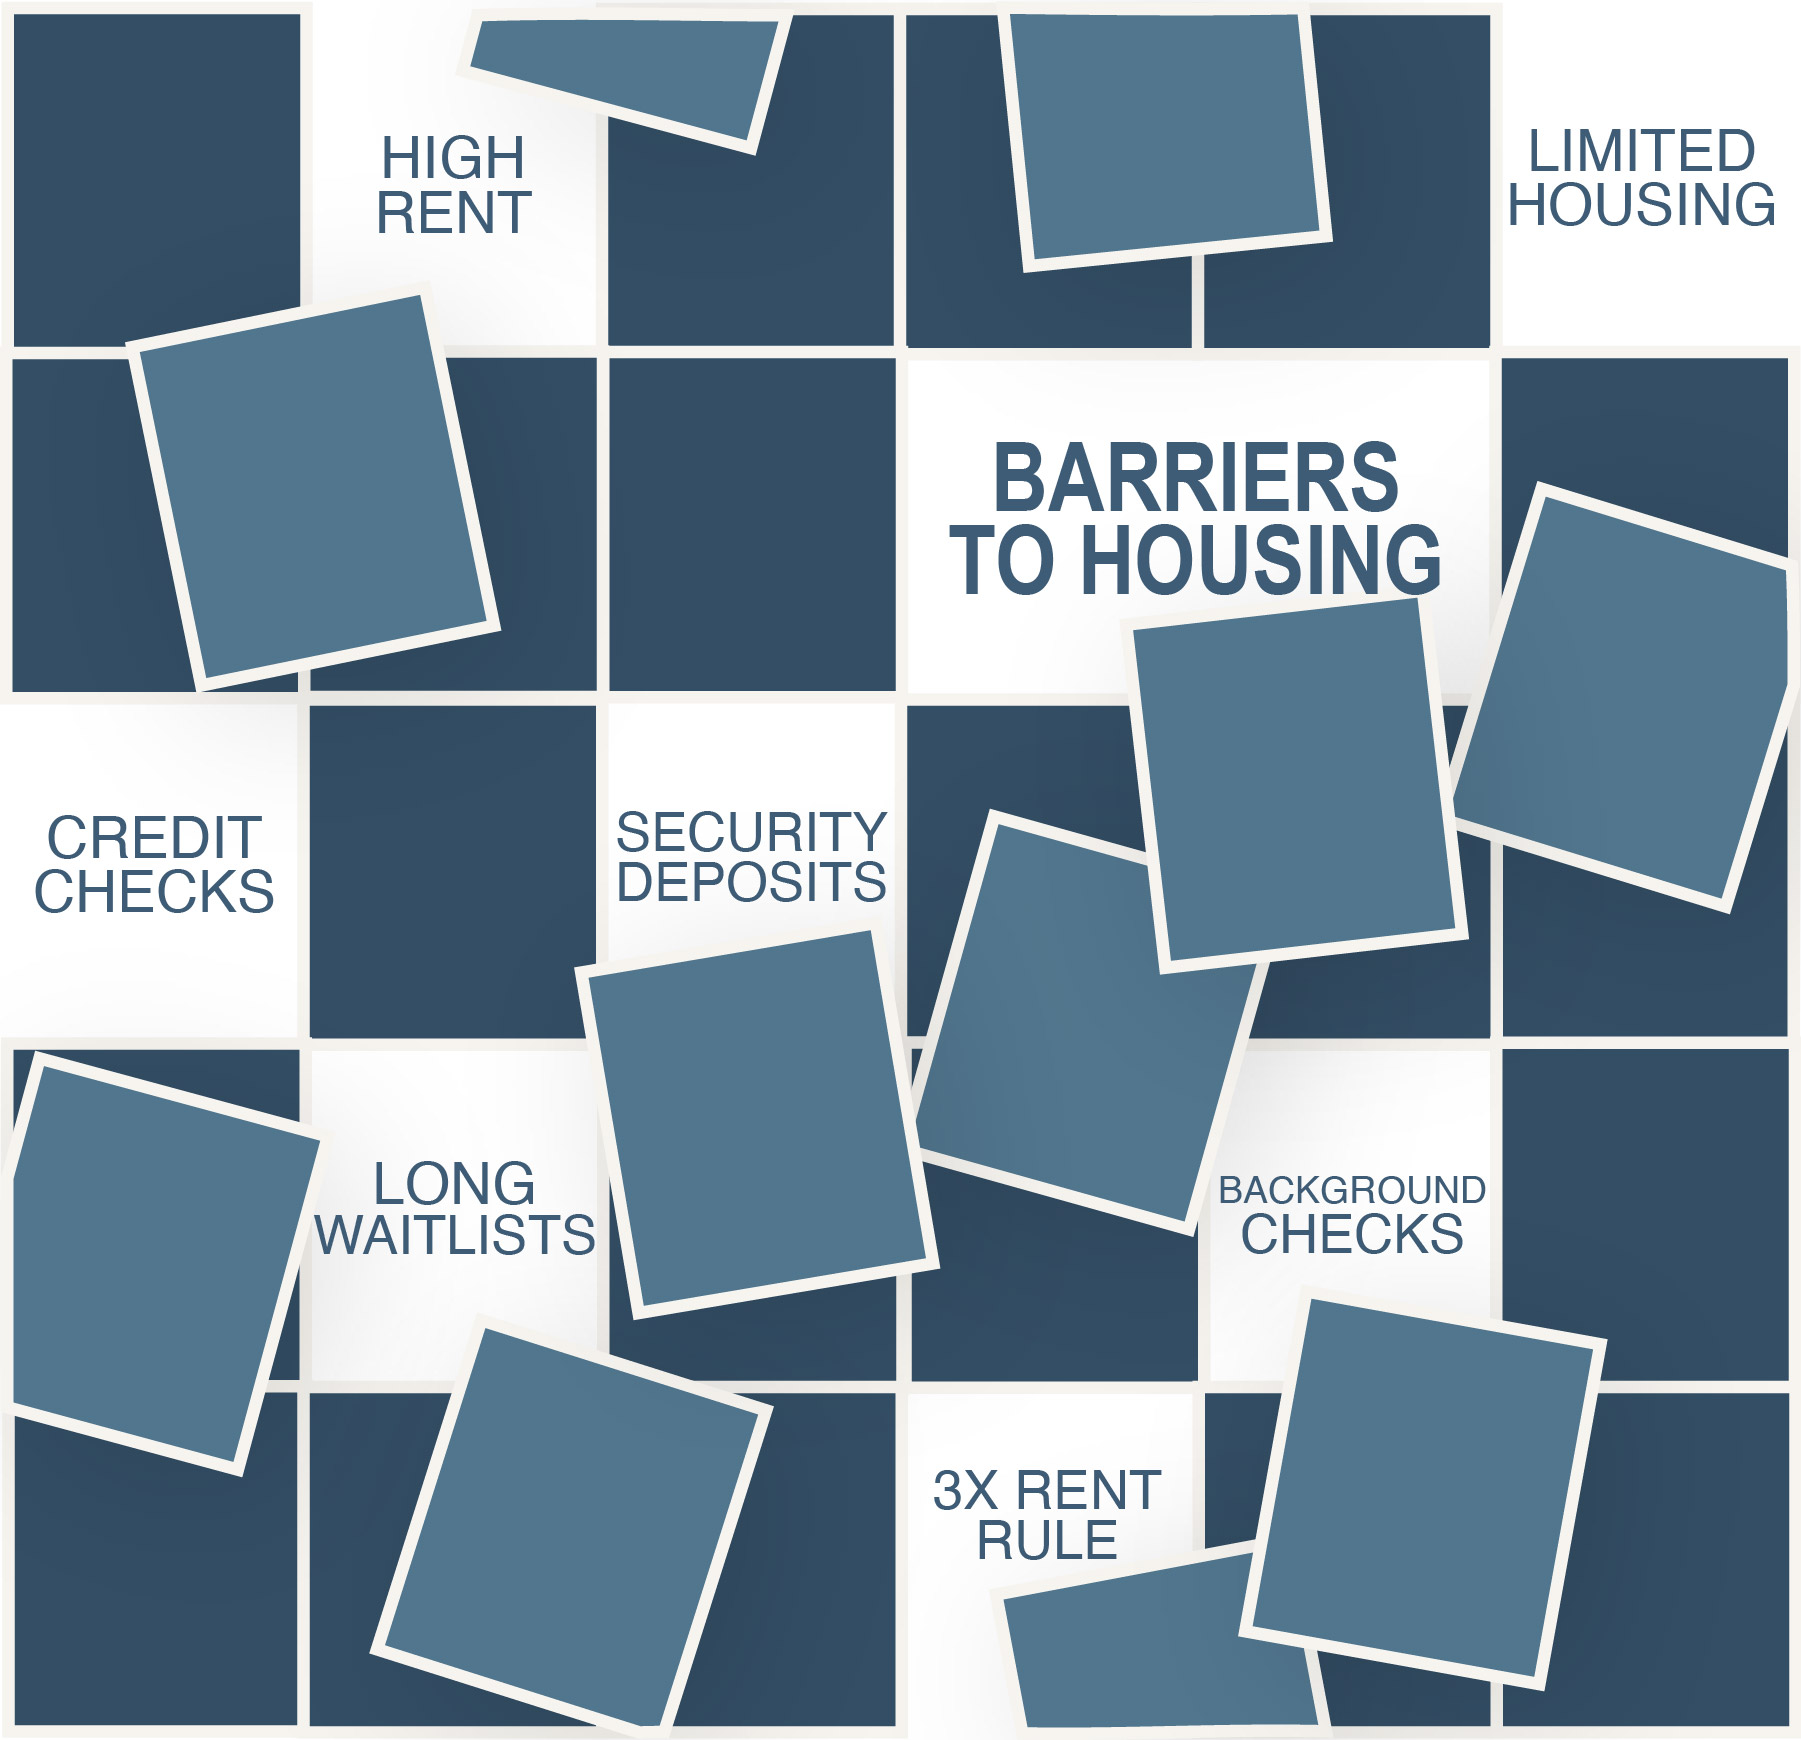
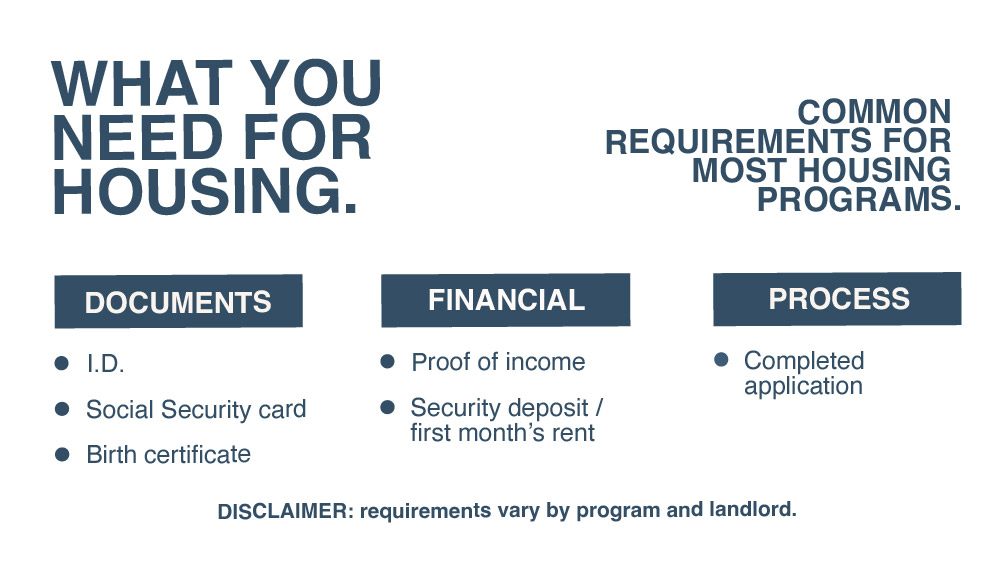
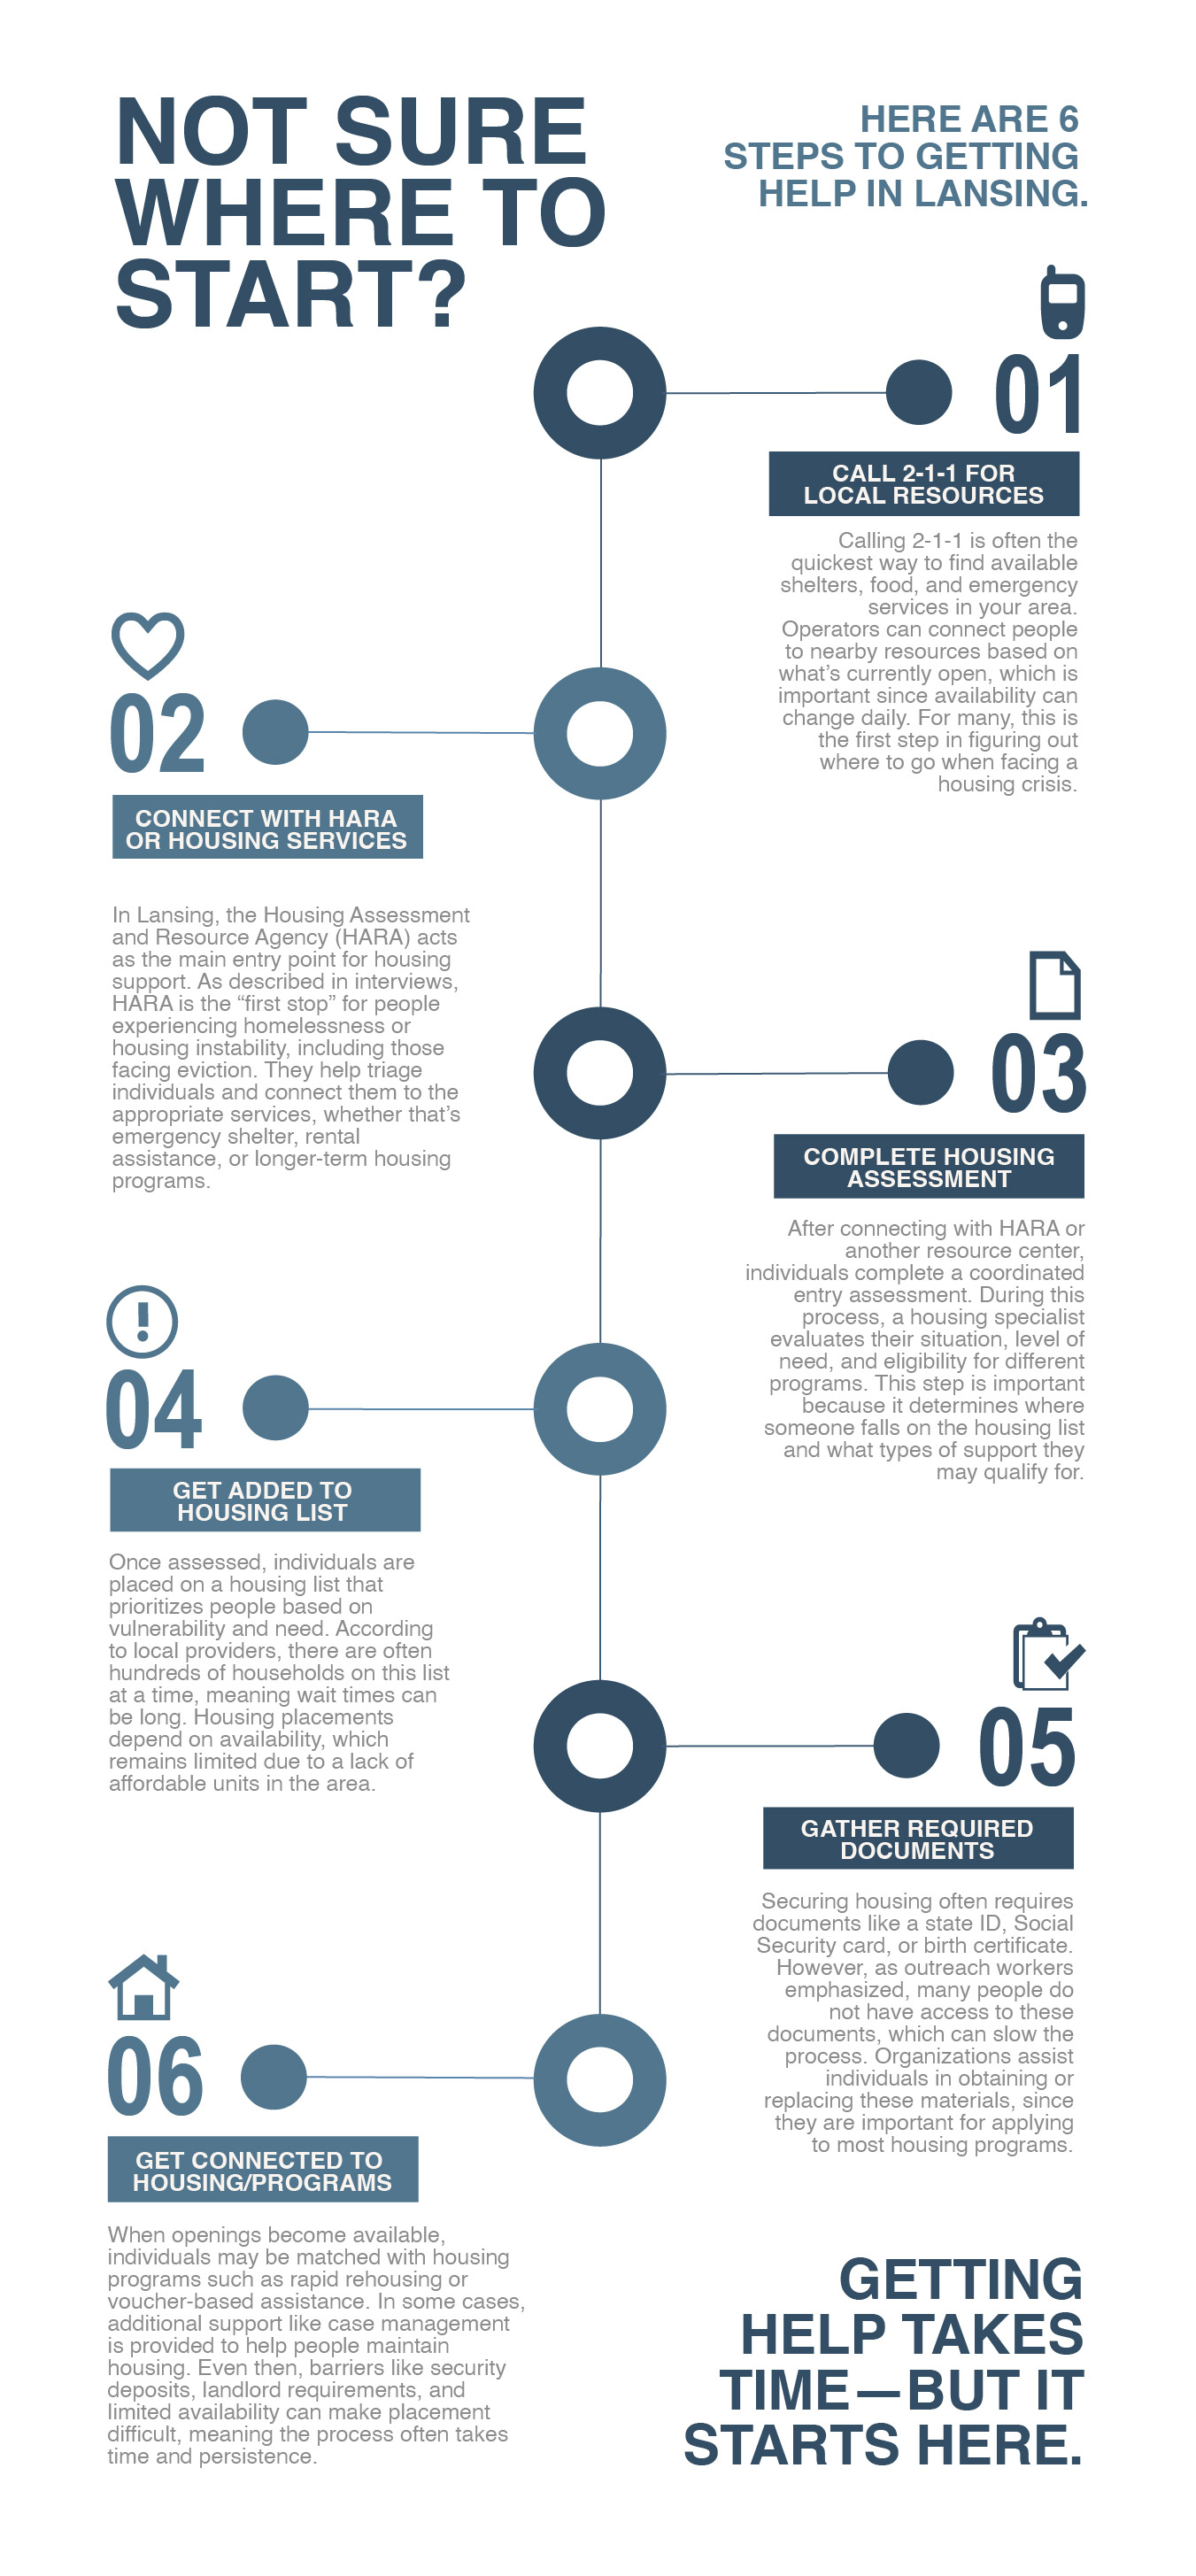
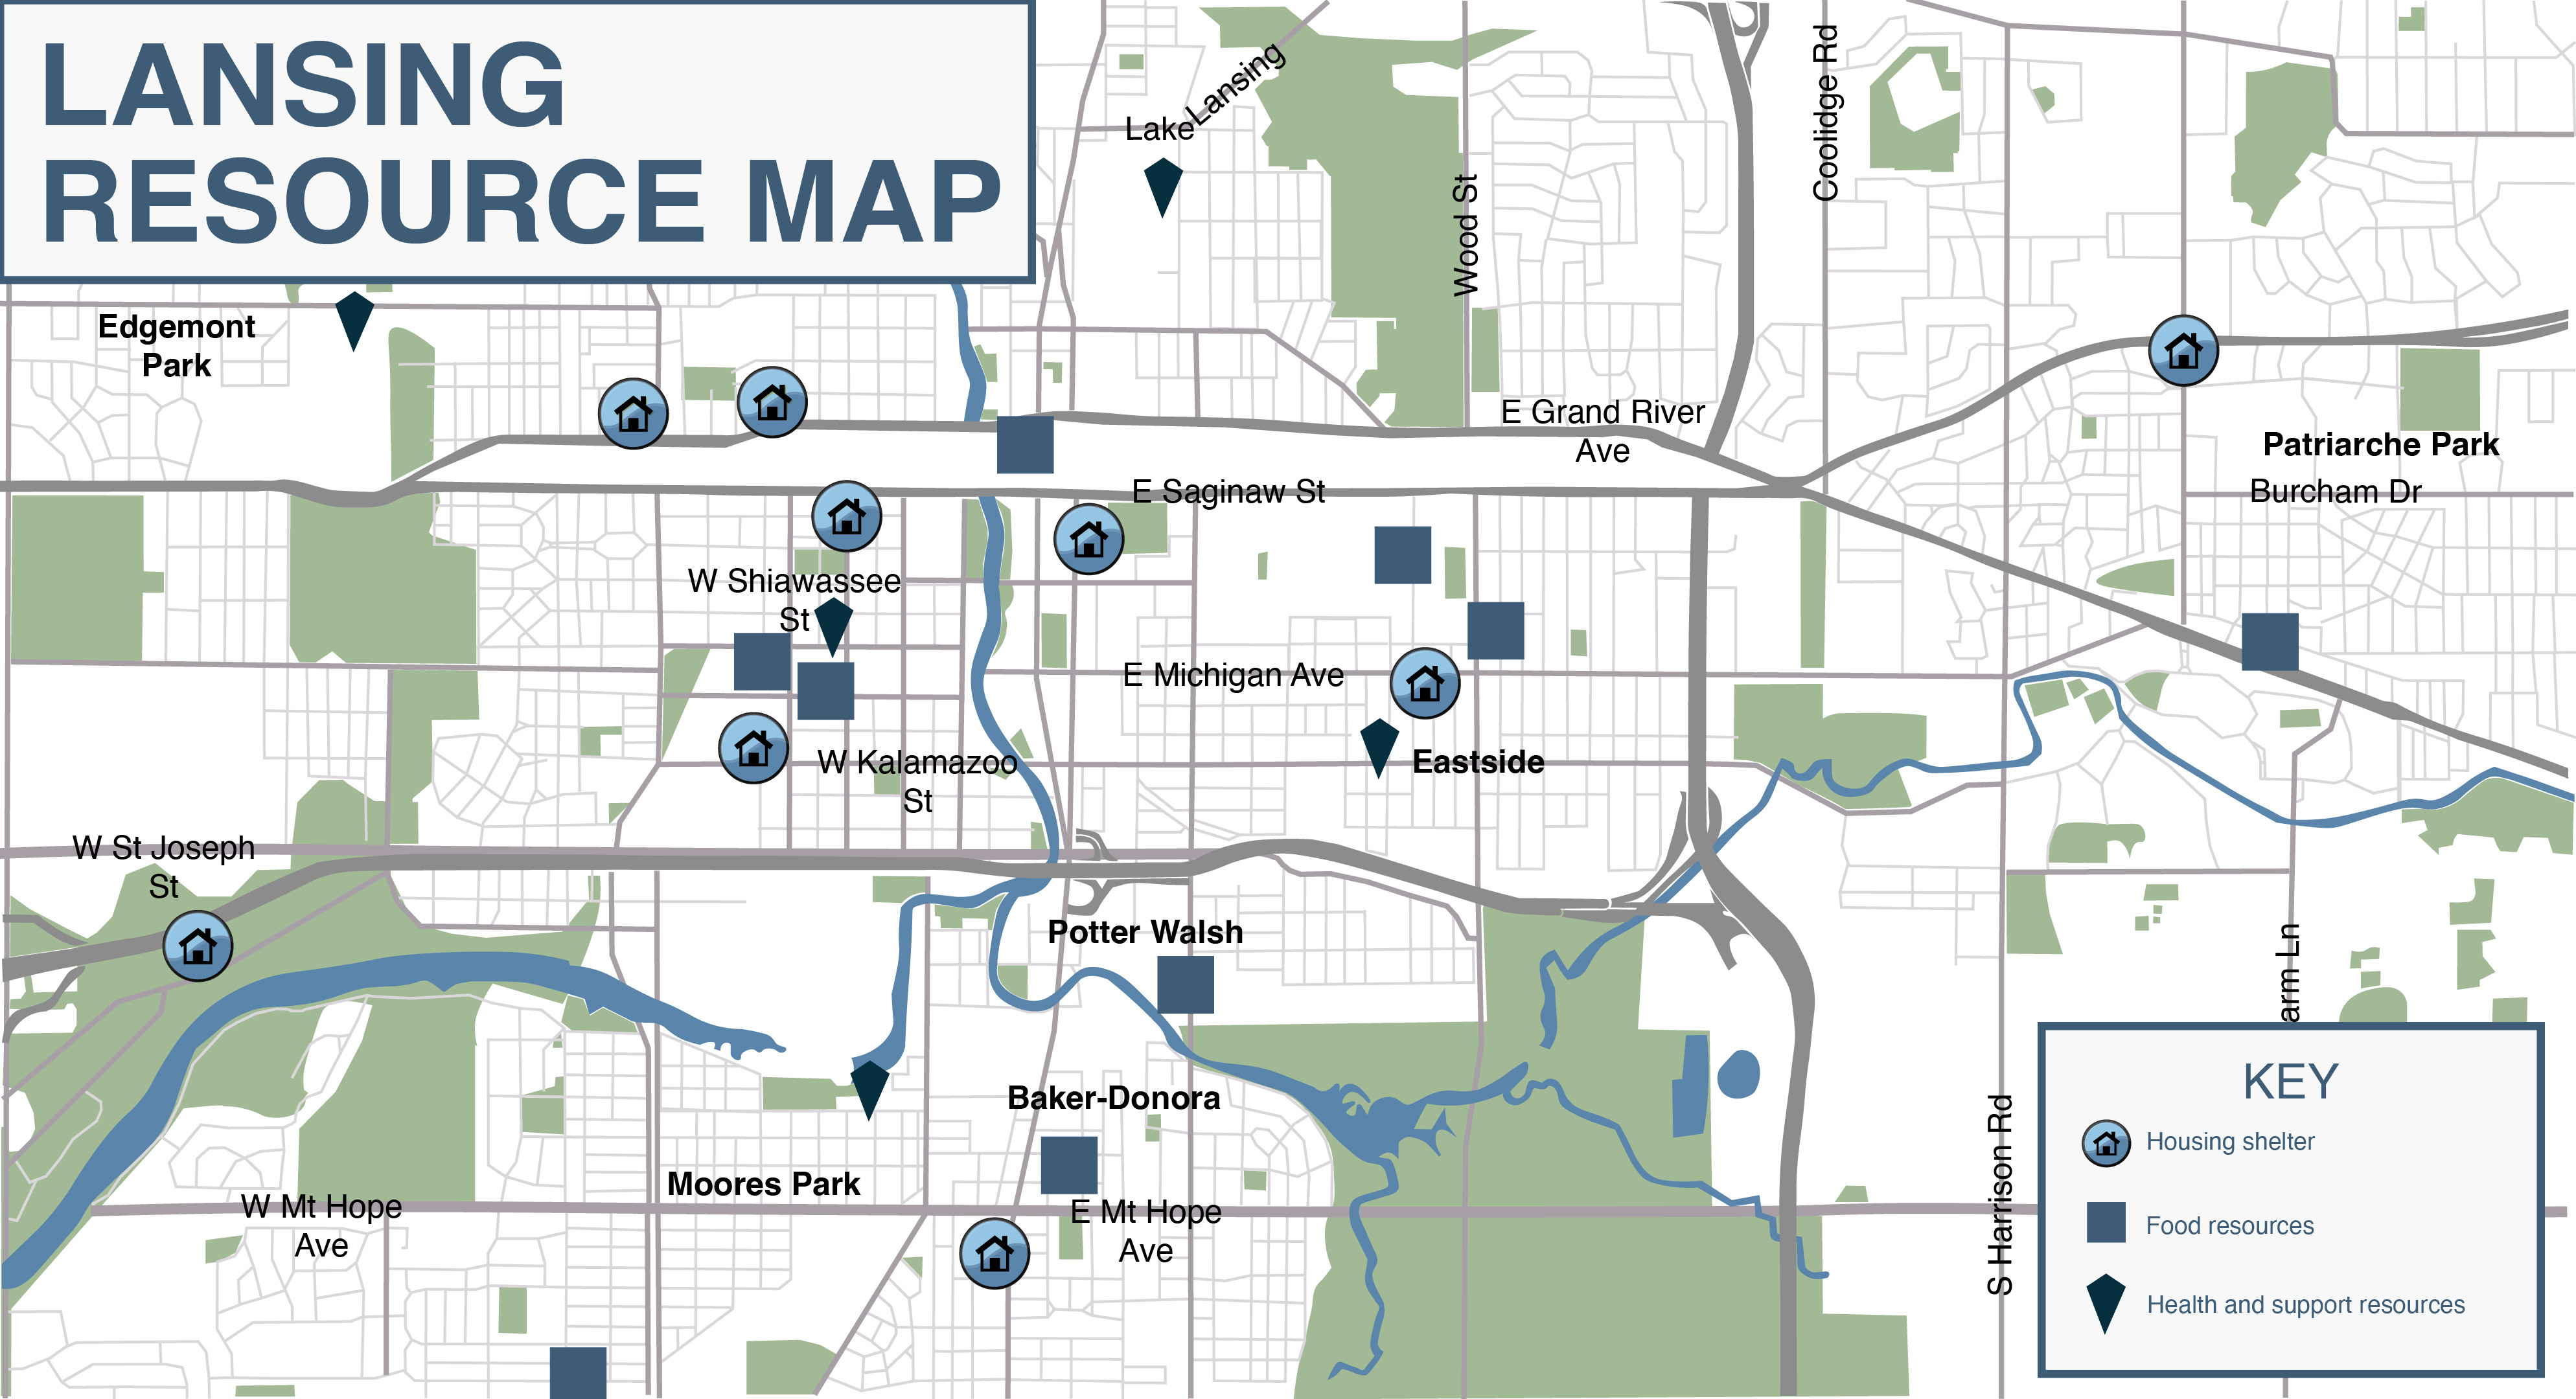
This work focuses on how a page comes together and how design choices shape the way someone reads and understands it. Programs used: Adobe InDesign and Photoshop.
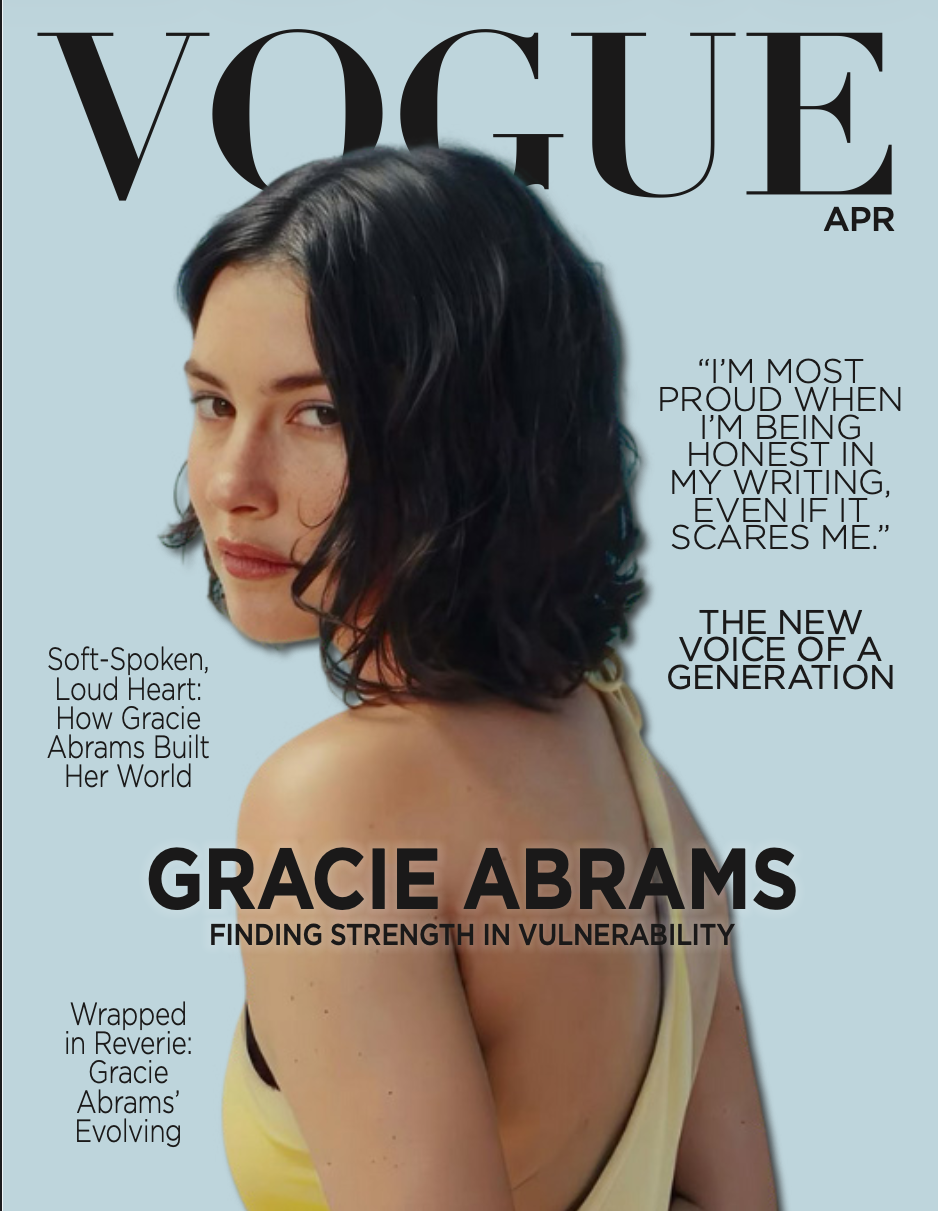 VIEW MAGAZINE →
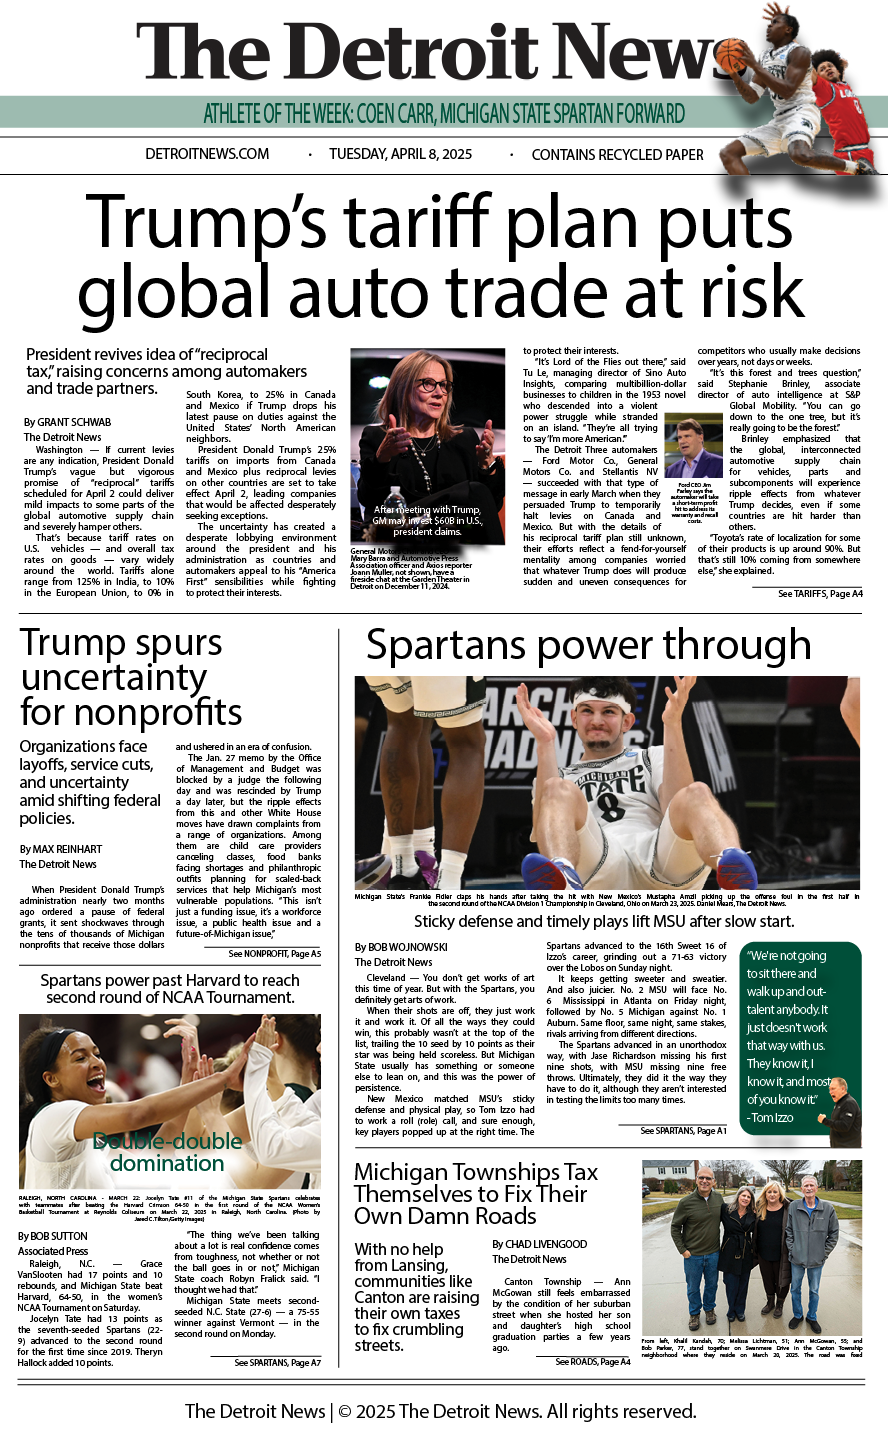 VIEW FULL SIZE →
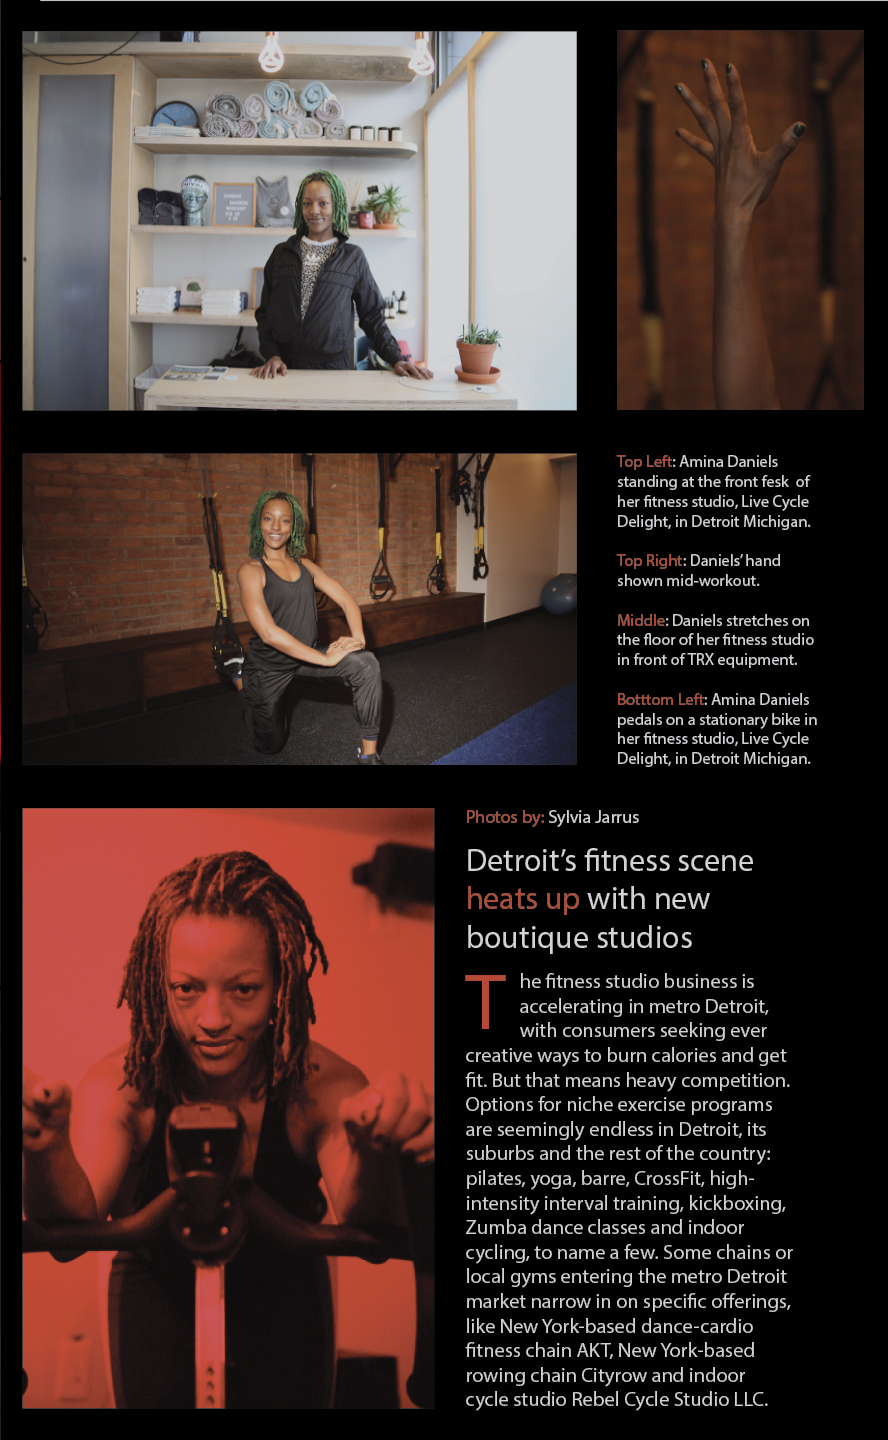 VIEW SPREAD →